Create better ideas for your graphics by using a roadmap
When it comes to generating good ideas to visualize your case, the overwhelming tendency is to begin by jumping right into brainstorming graphic concepts—torturing analogies for hours, or fixating on a particular visual.
It’s easy to get sideways (and over budget) with an unstructured, trial-and-error approach.
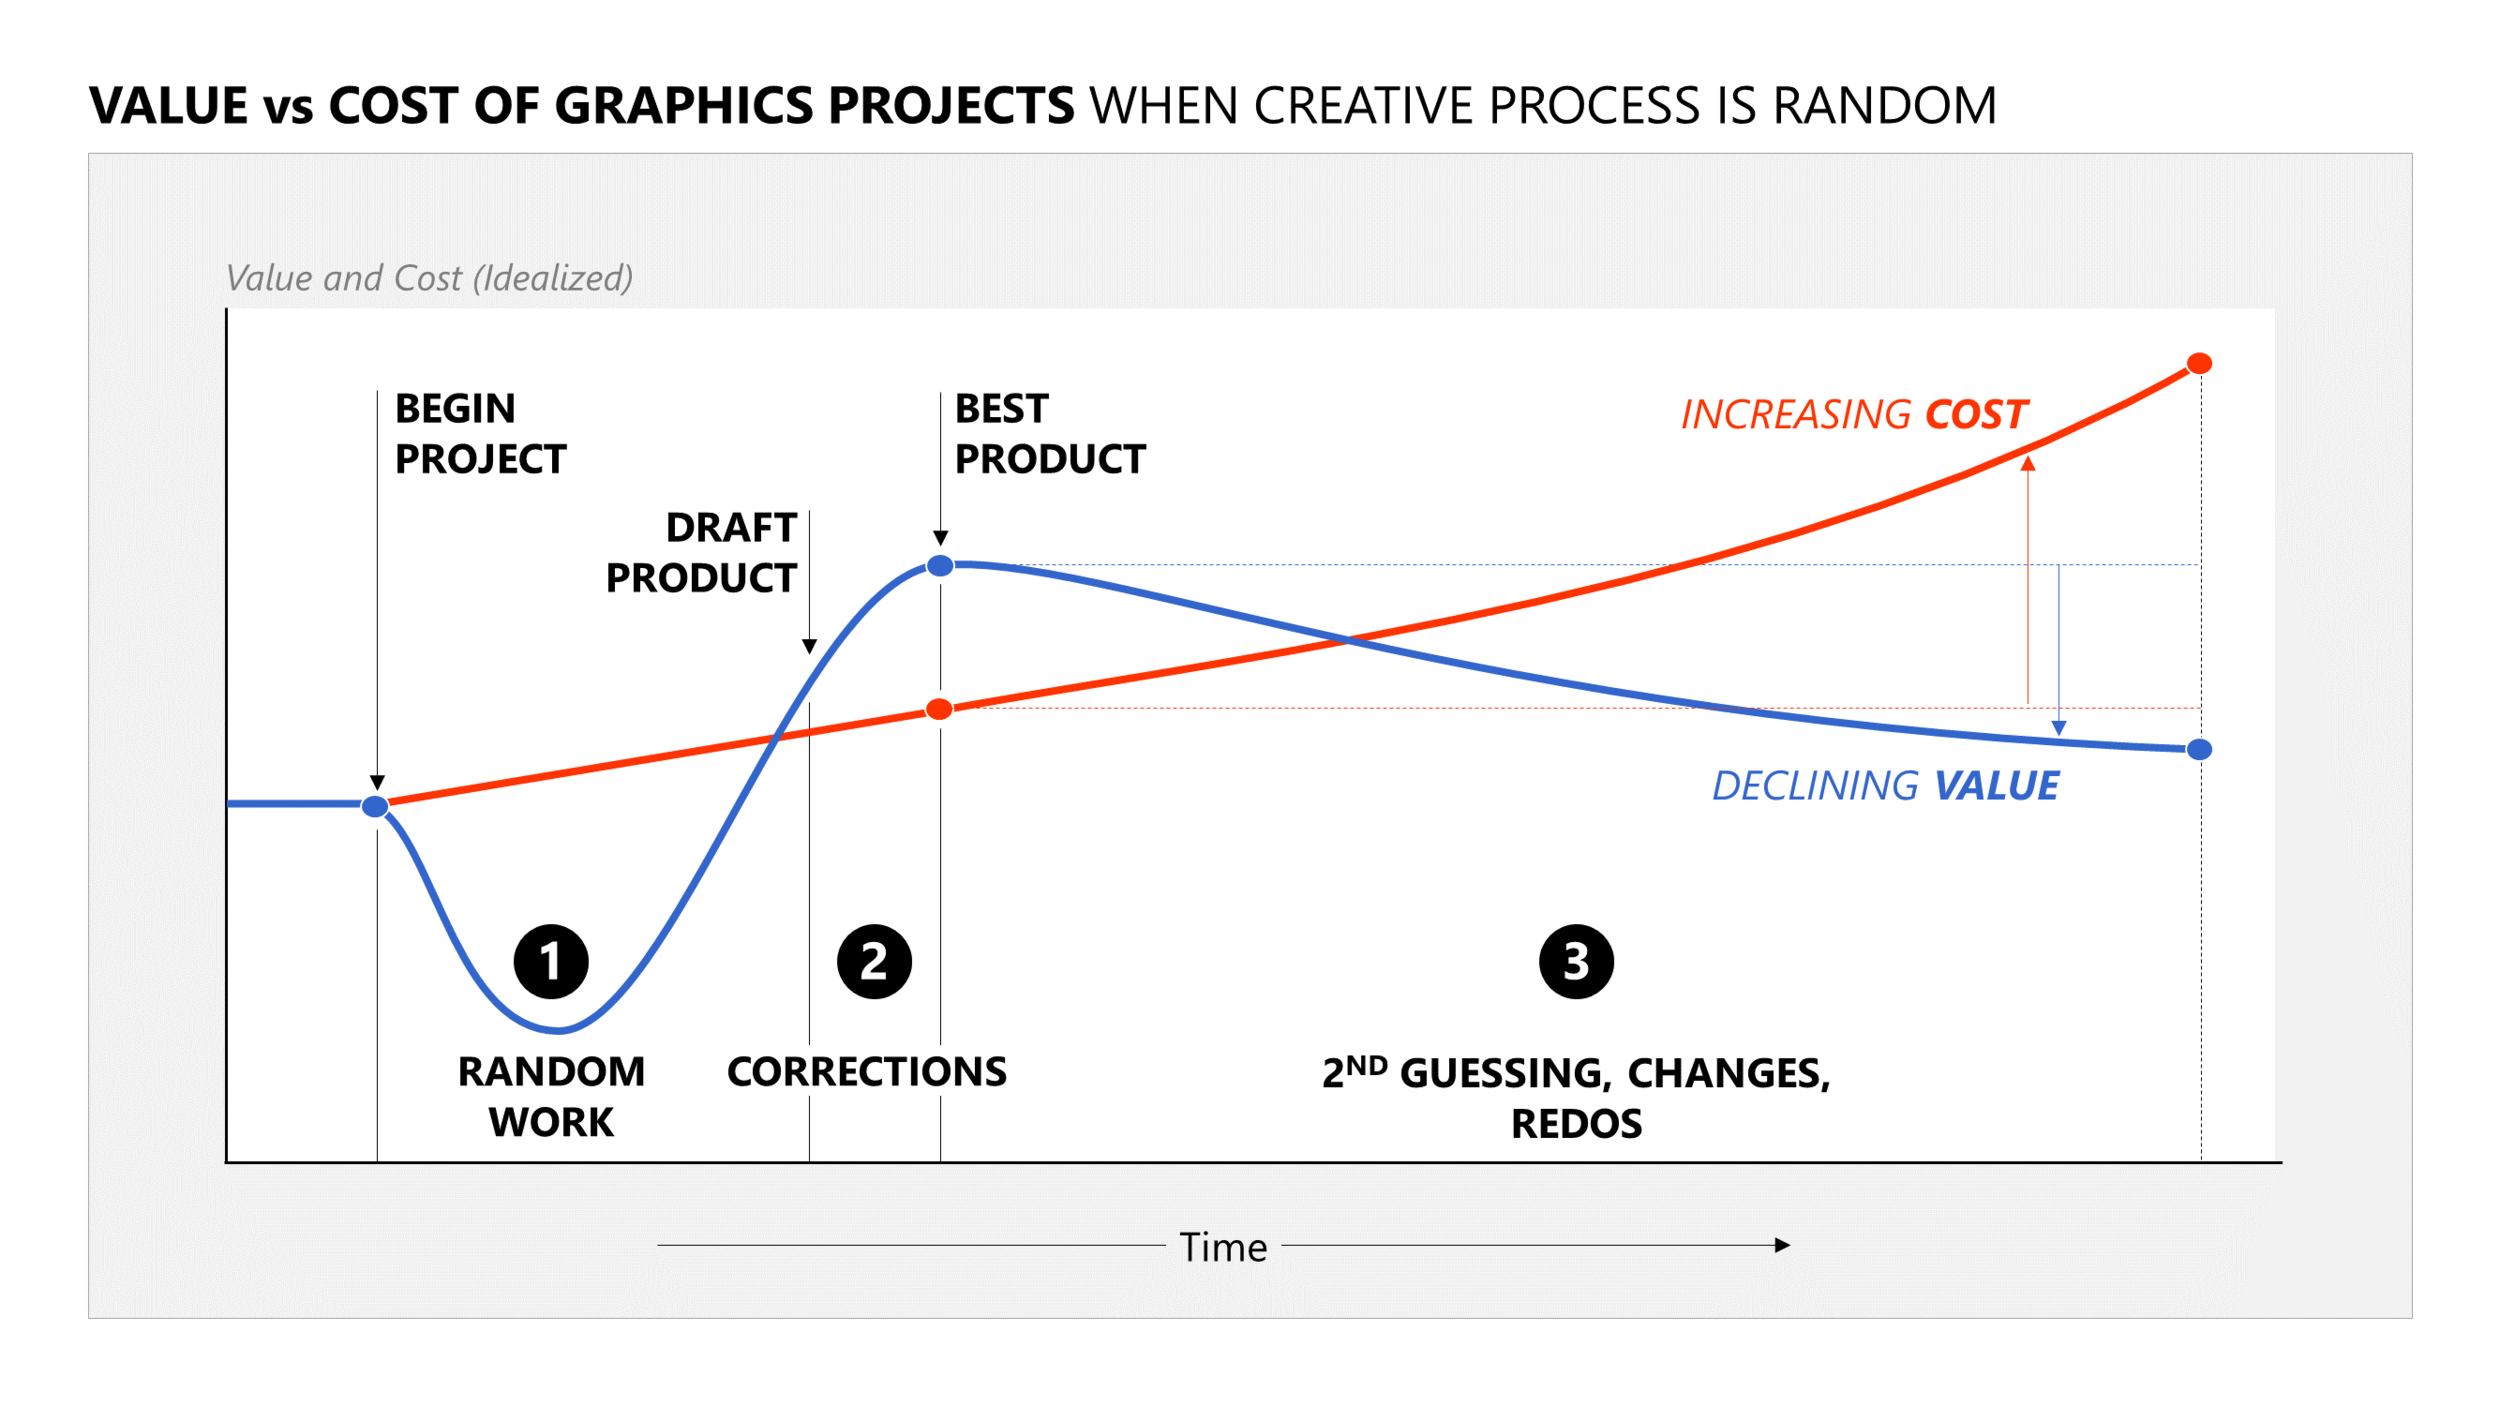
An idealized curve representing the productivity of a random creative process is shown, mapped against cost. We start with a trough of non-linear idea-seeking, followed by production of draft graphics. This is positive movement, and with corrections, the team reaches what tends to be the best product. This is too often followed by a period of second guessing, over-editing and re-doing. That 3rd period can be a huge cost driver, especially in a trial environment, and it can produce an actual decline in the quality and value of the product.
The alternative I offer begins with words, not pictures. Just as a script drives a movie, a considered roadmap should drive your graphics. When you practice this, good ideas just come to you—and they tend to be ideas born of your narrative, not pasted onto it.
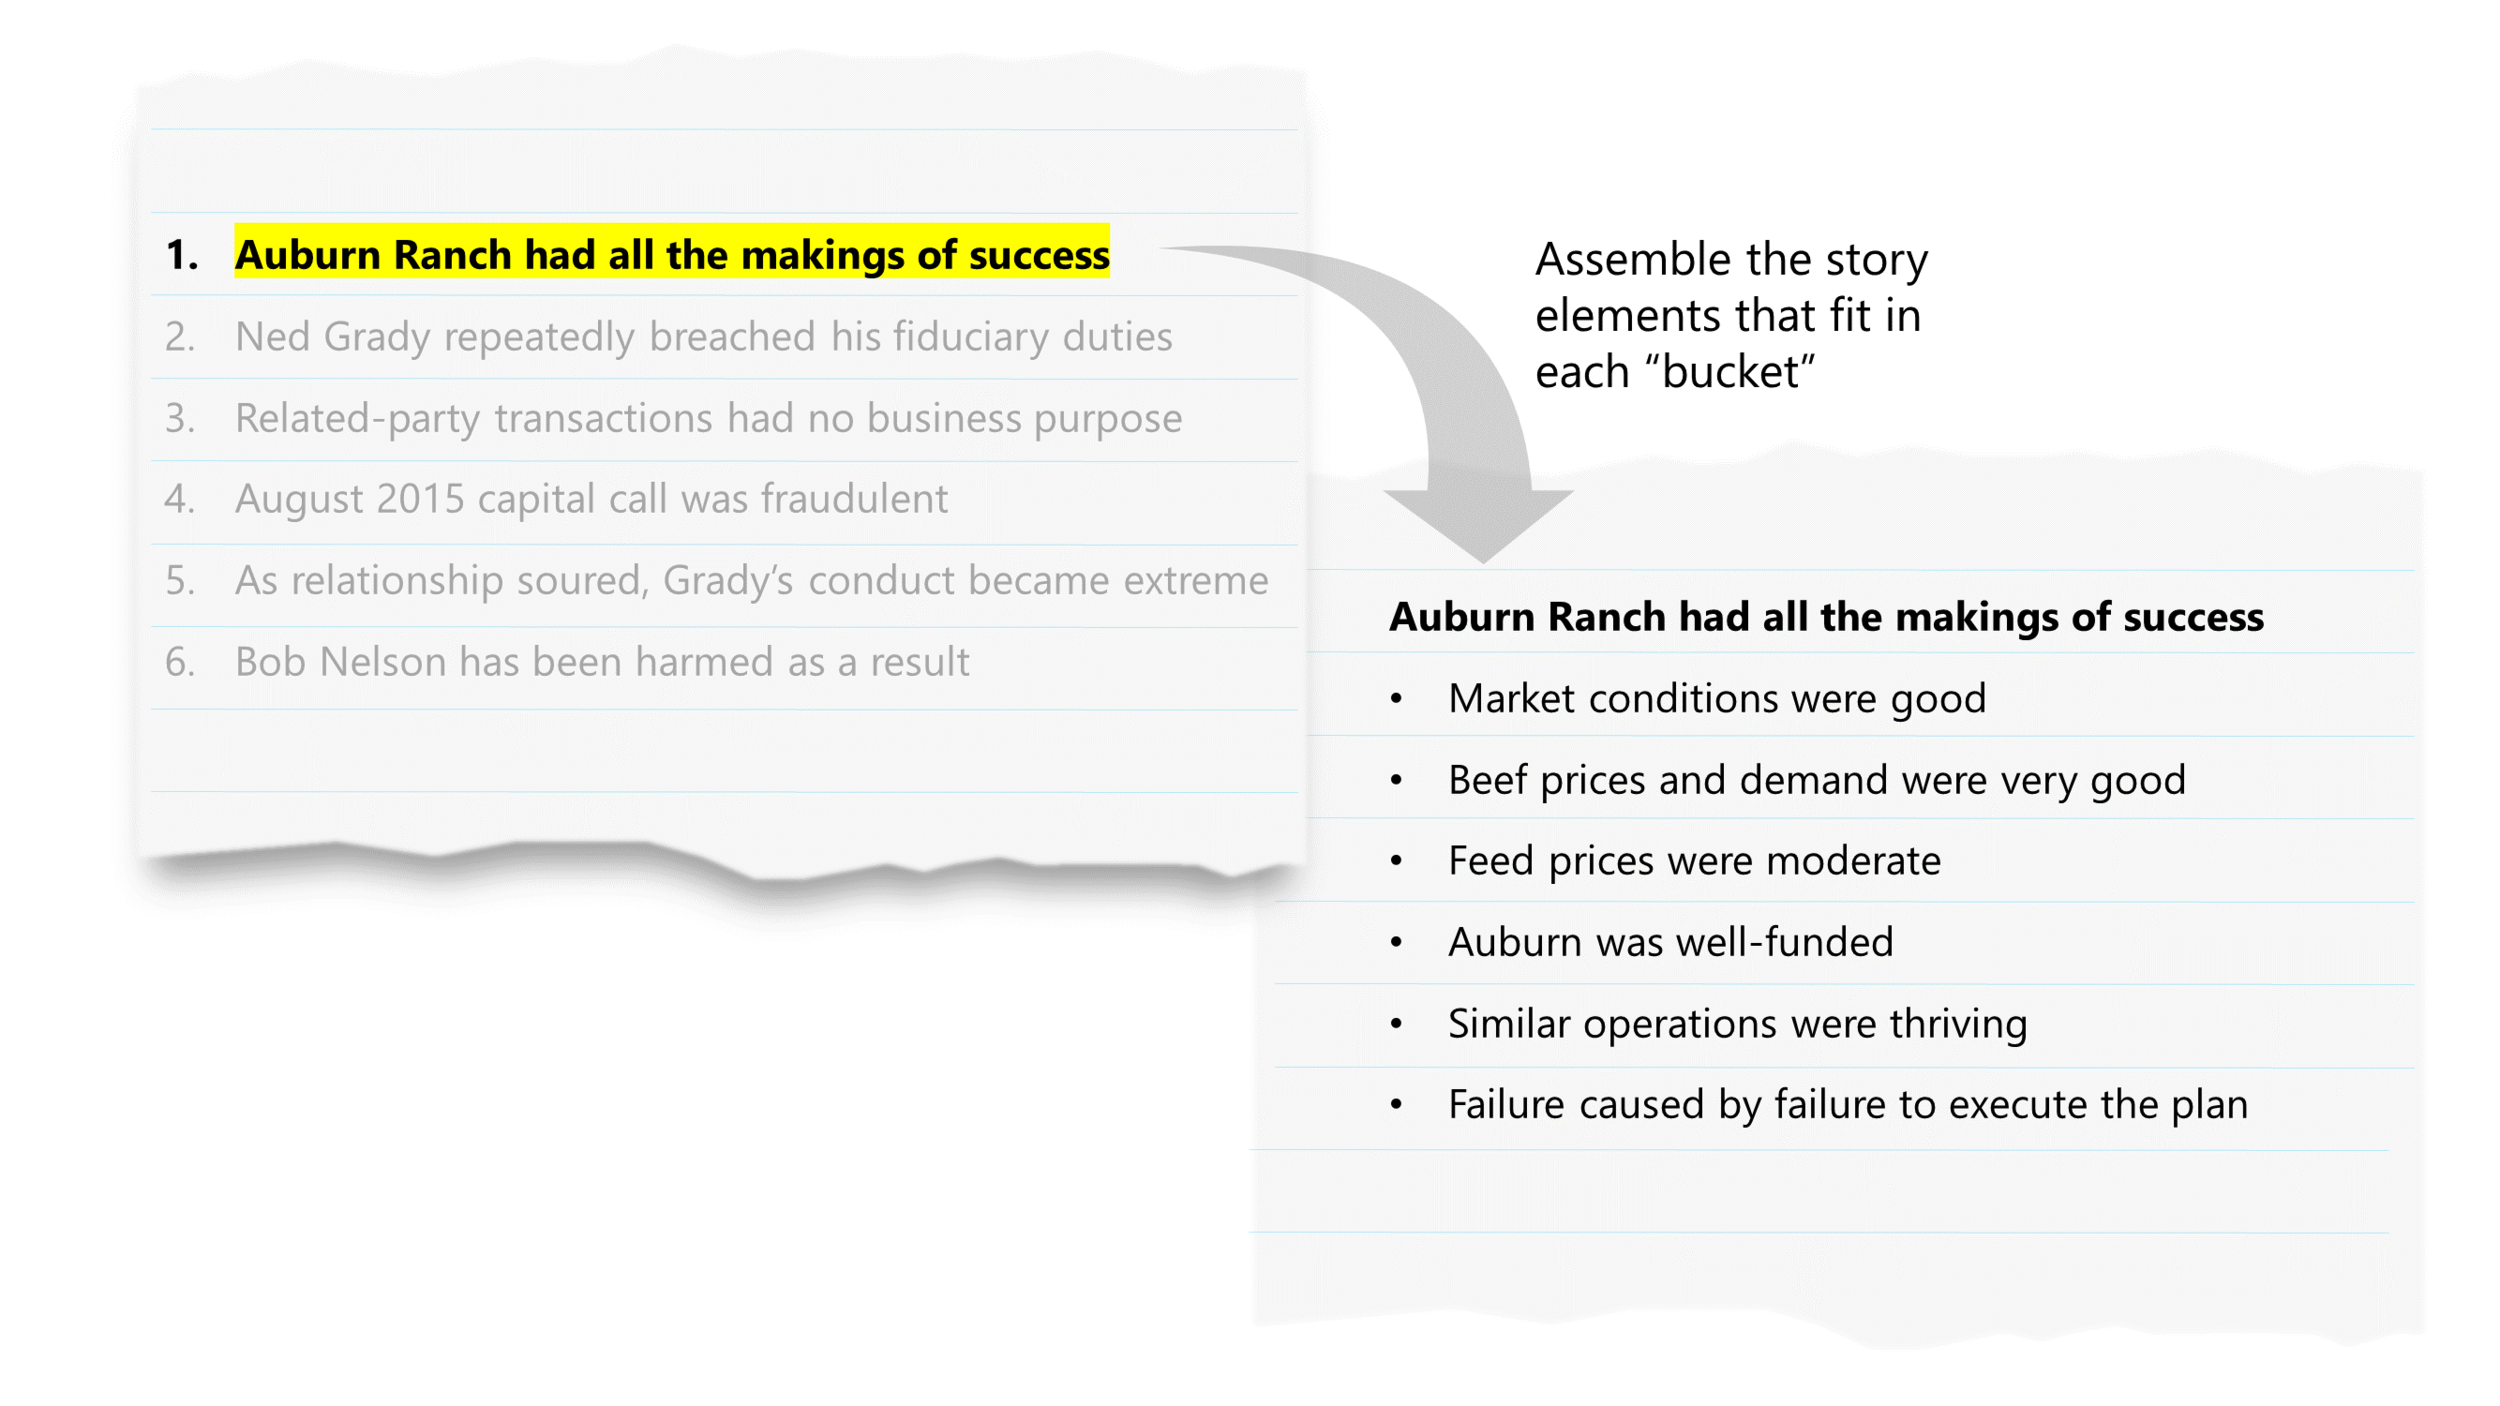
I recommend starting with drafting the big bullet points (usually 3-6) that represent the “chapters” or “buckets” your story fits into. Once you have filled the buckets with their narrative contents, you can plug in your evidence where it fits to best prove each point.
Here is the logical architecture described above, as you might outline for a deck to support your opening statement. It is in short-hand form mainly for ease of use, but that’s a good way to simplify your thinking too. This approach gives you a structure for considering how graphics fit in and help you tell your story. It also is useful as a way of diagramming how the evidence aligns with what you’re saying.
Now you have an outline that contains everything needed to create a rough “storyboard.” This is the part of the process that I still think is kind of magical: as you review your outline point-by-point, it becomes obvious what kind of image—be it evidentiary or demonstrative—goes with each point. Often you might come up with many concepts for the same issue, providing the luxury of trying multiple ideas to find out which might render the most solid graphic.
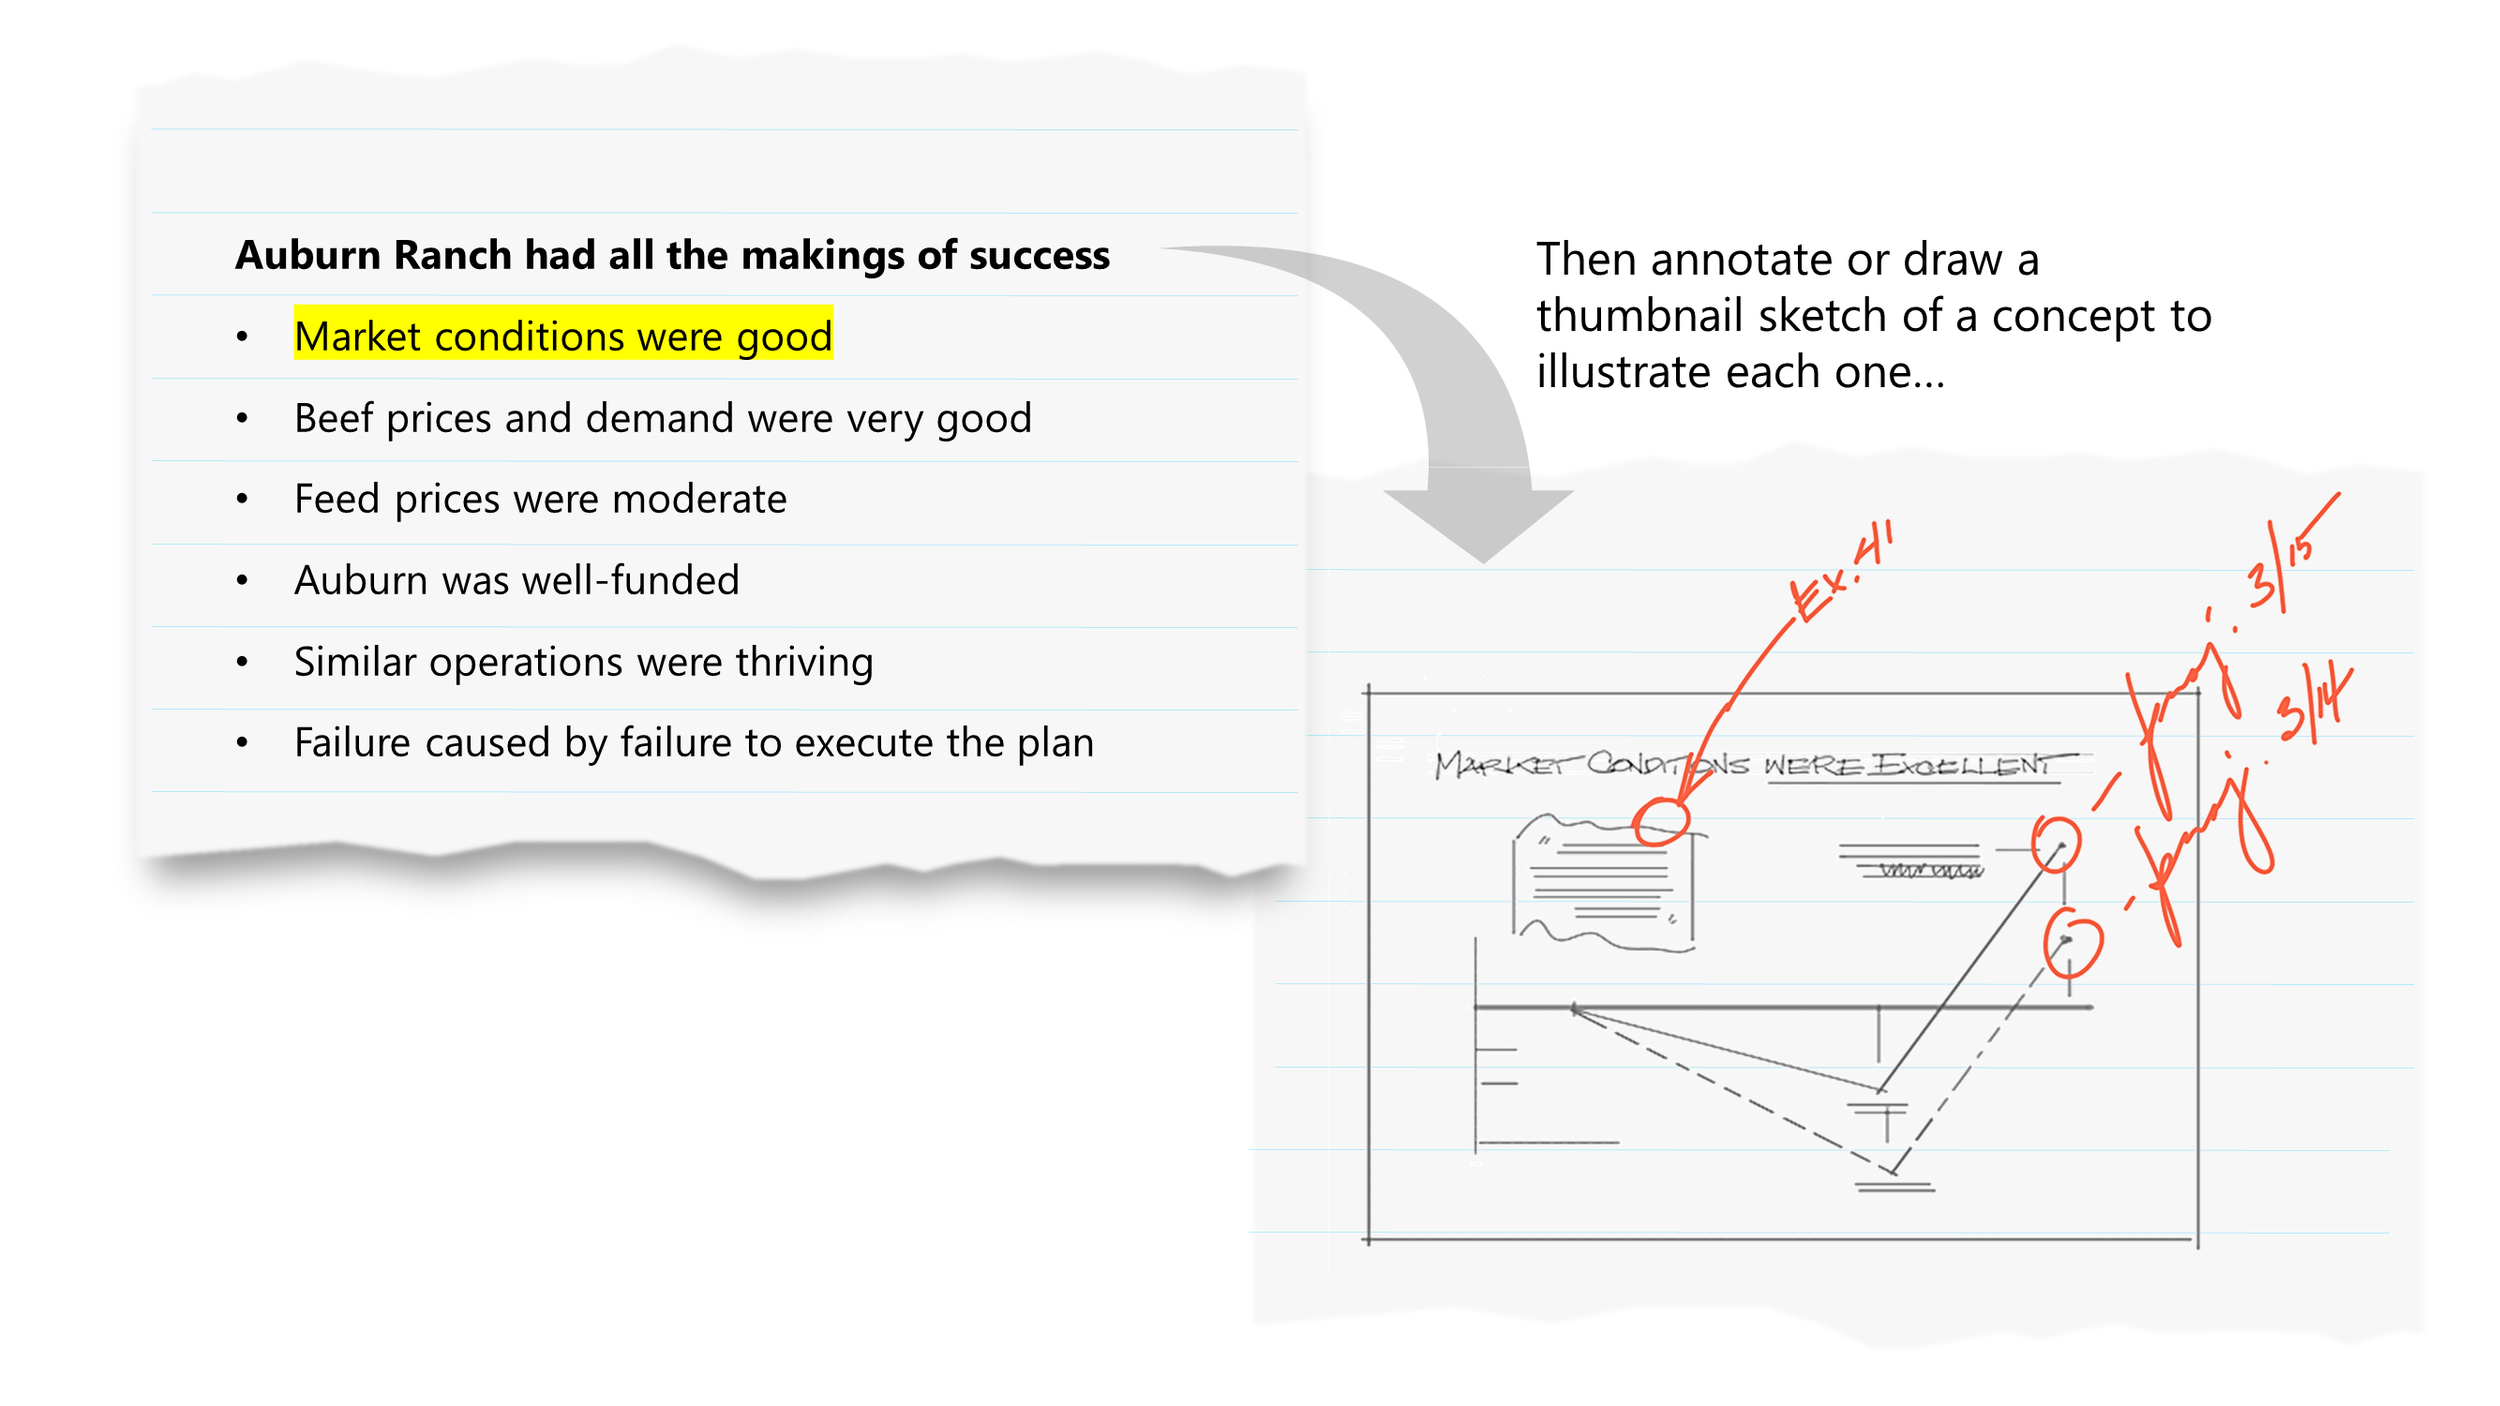
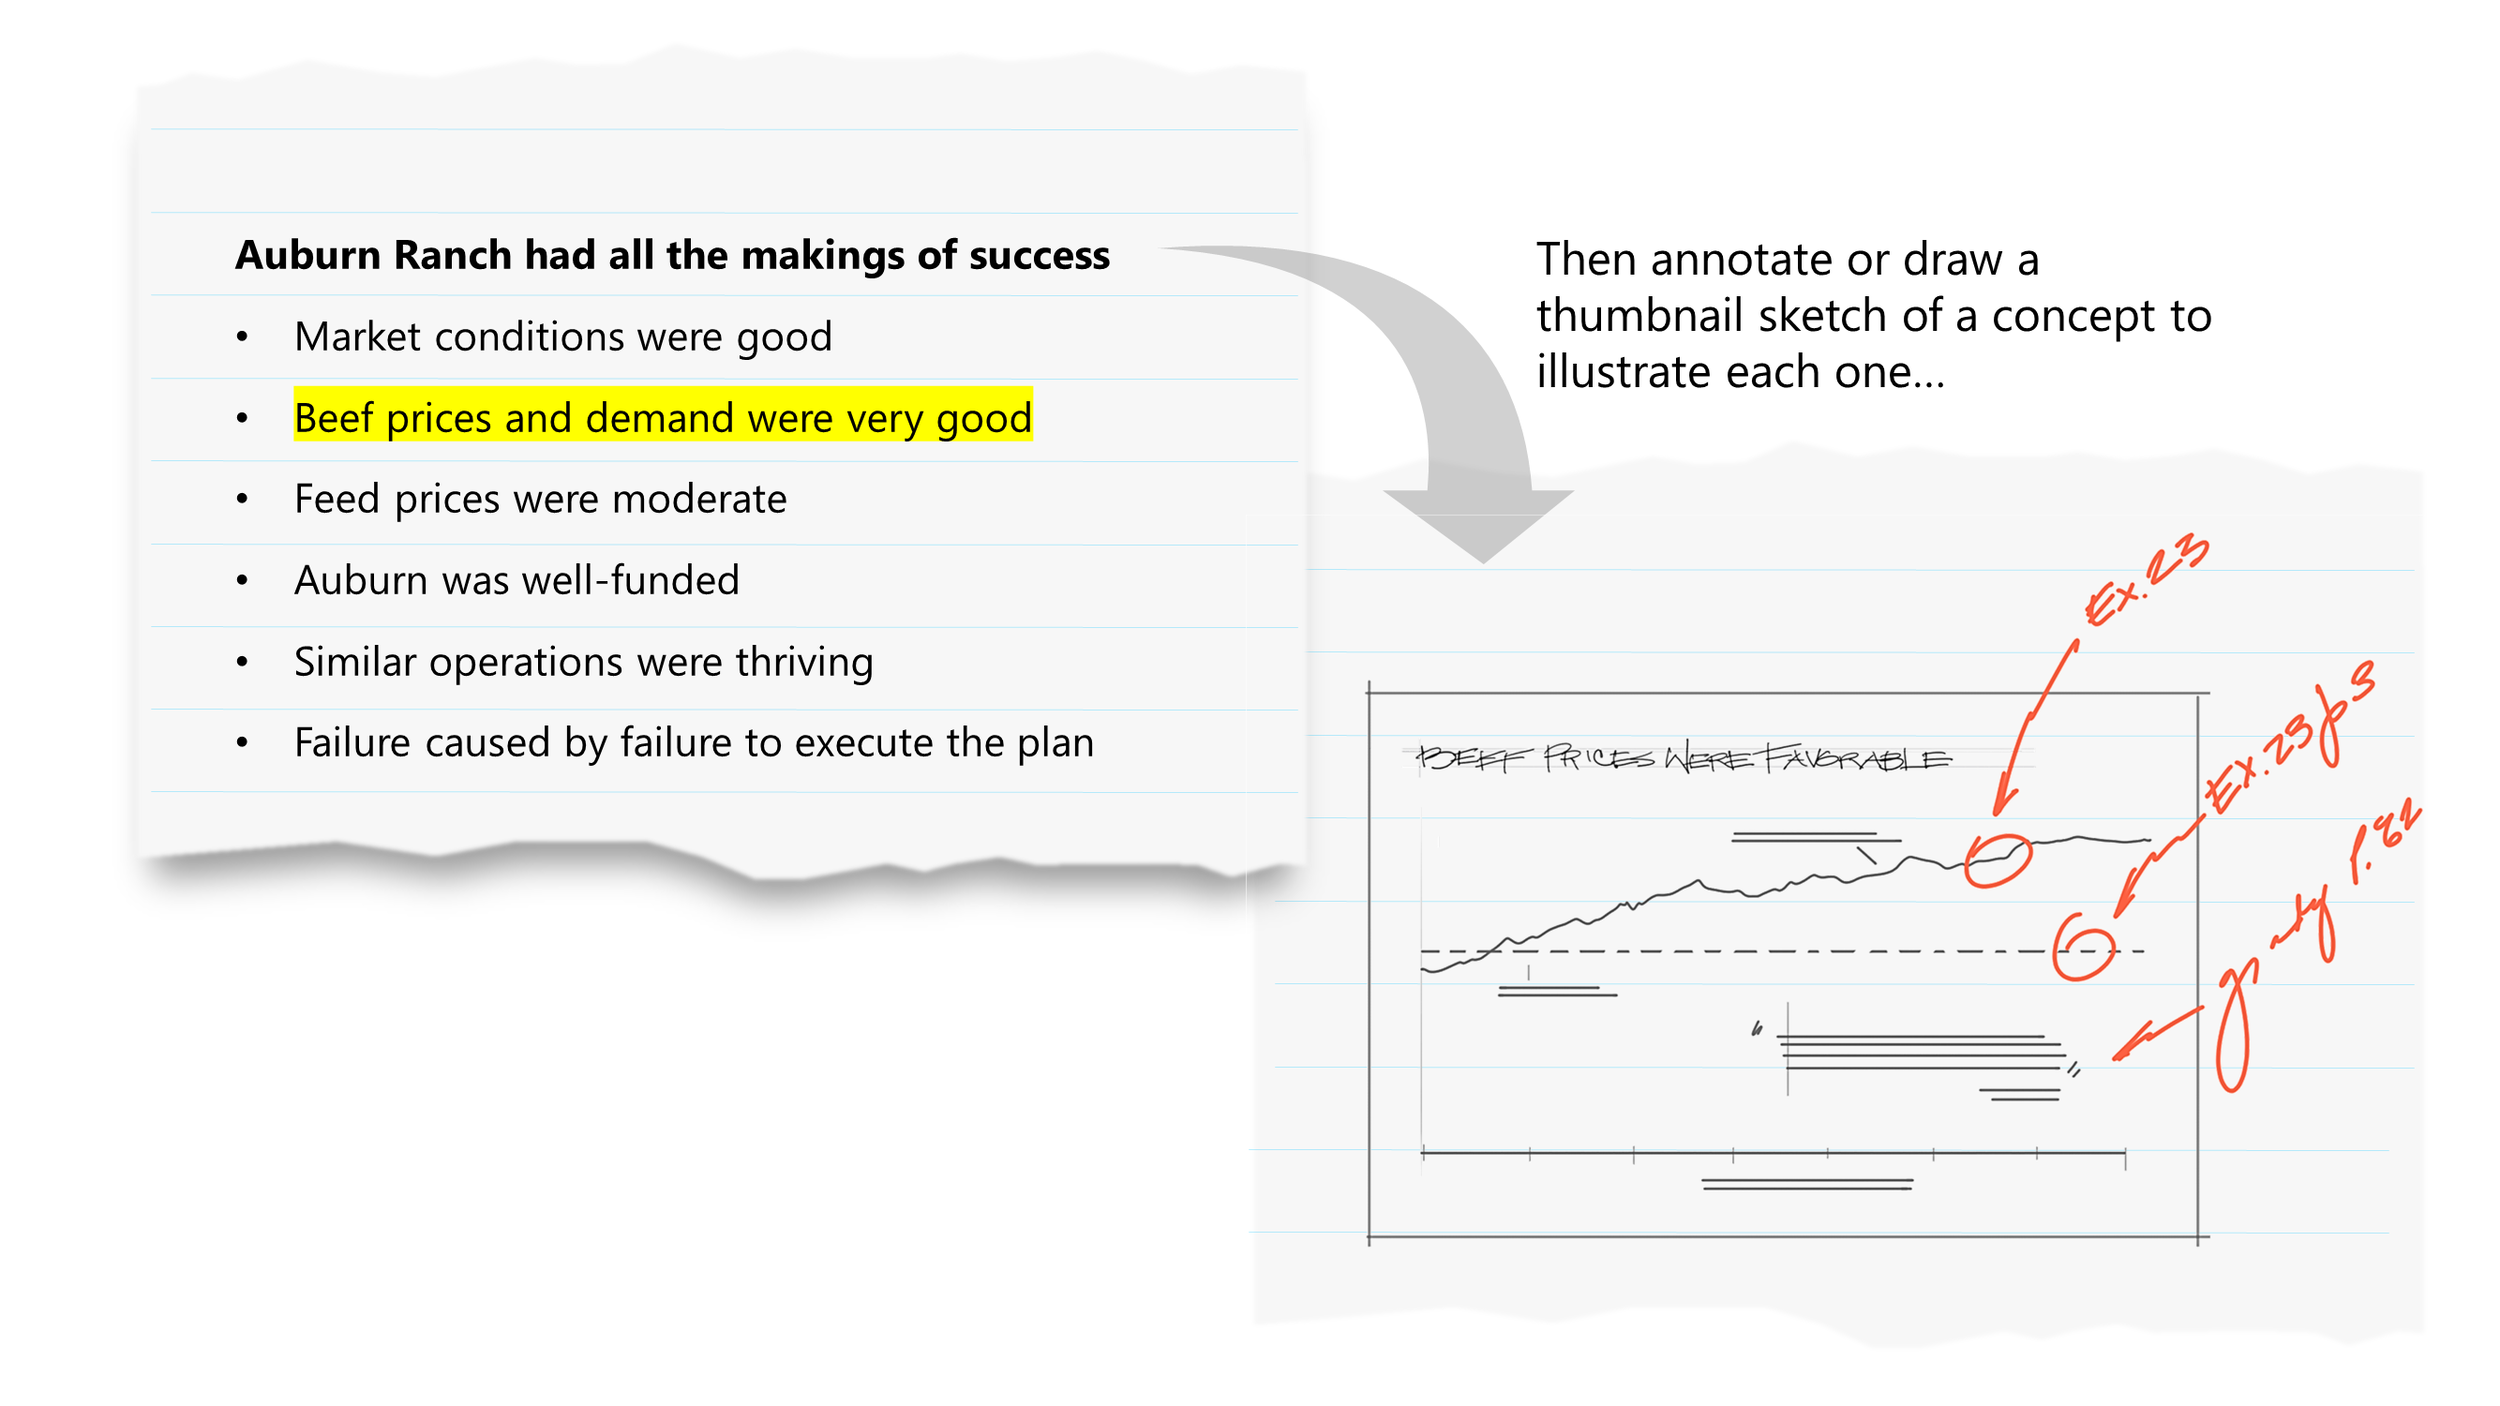
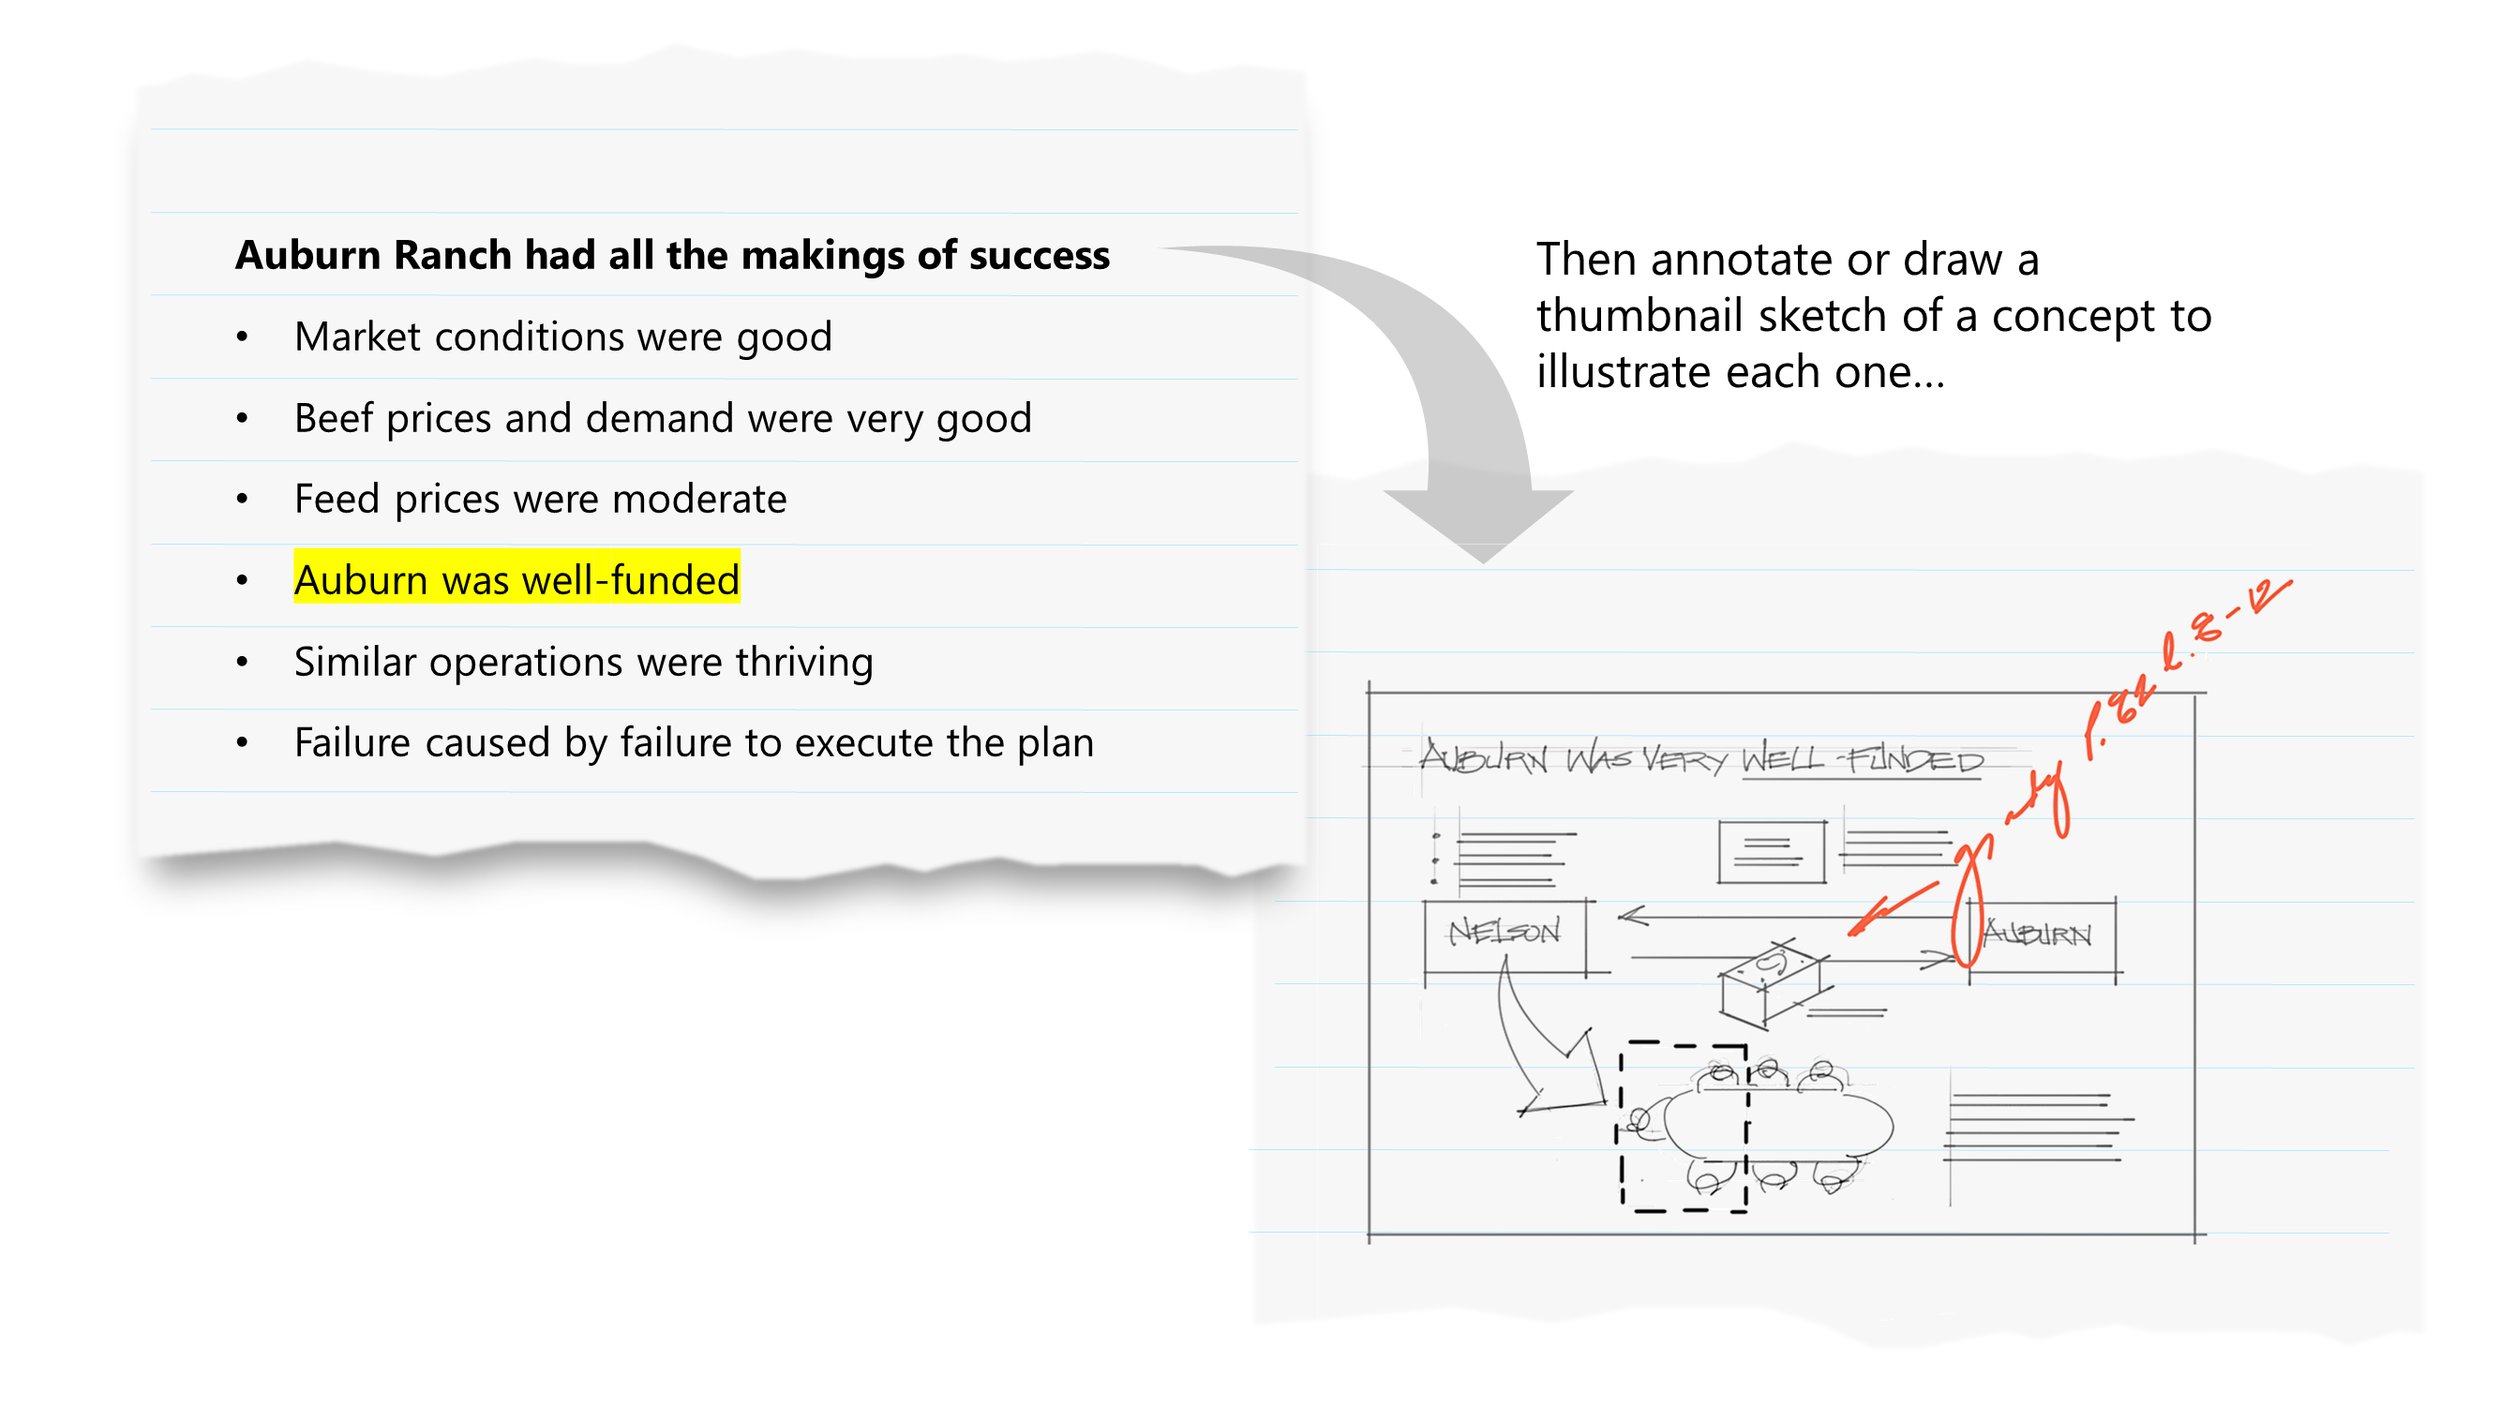
The discipline here is to let your words drive the pictures—if your outline is strong, your presentation will be as well. With simple notation or drawing stick figures, you can quickly create a skeleton of your presentation (oral argument, opening statement, expert deck or closing argument). This is a significant step beyond any likely product of a brainstorming session.
Here’s my process for building any graphic presentation, in a nutshell:
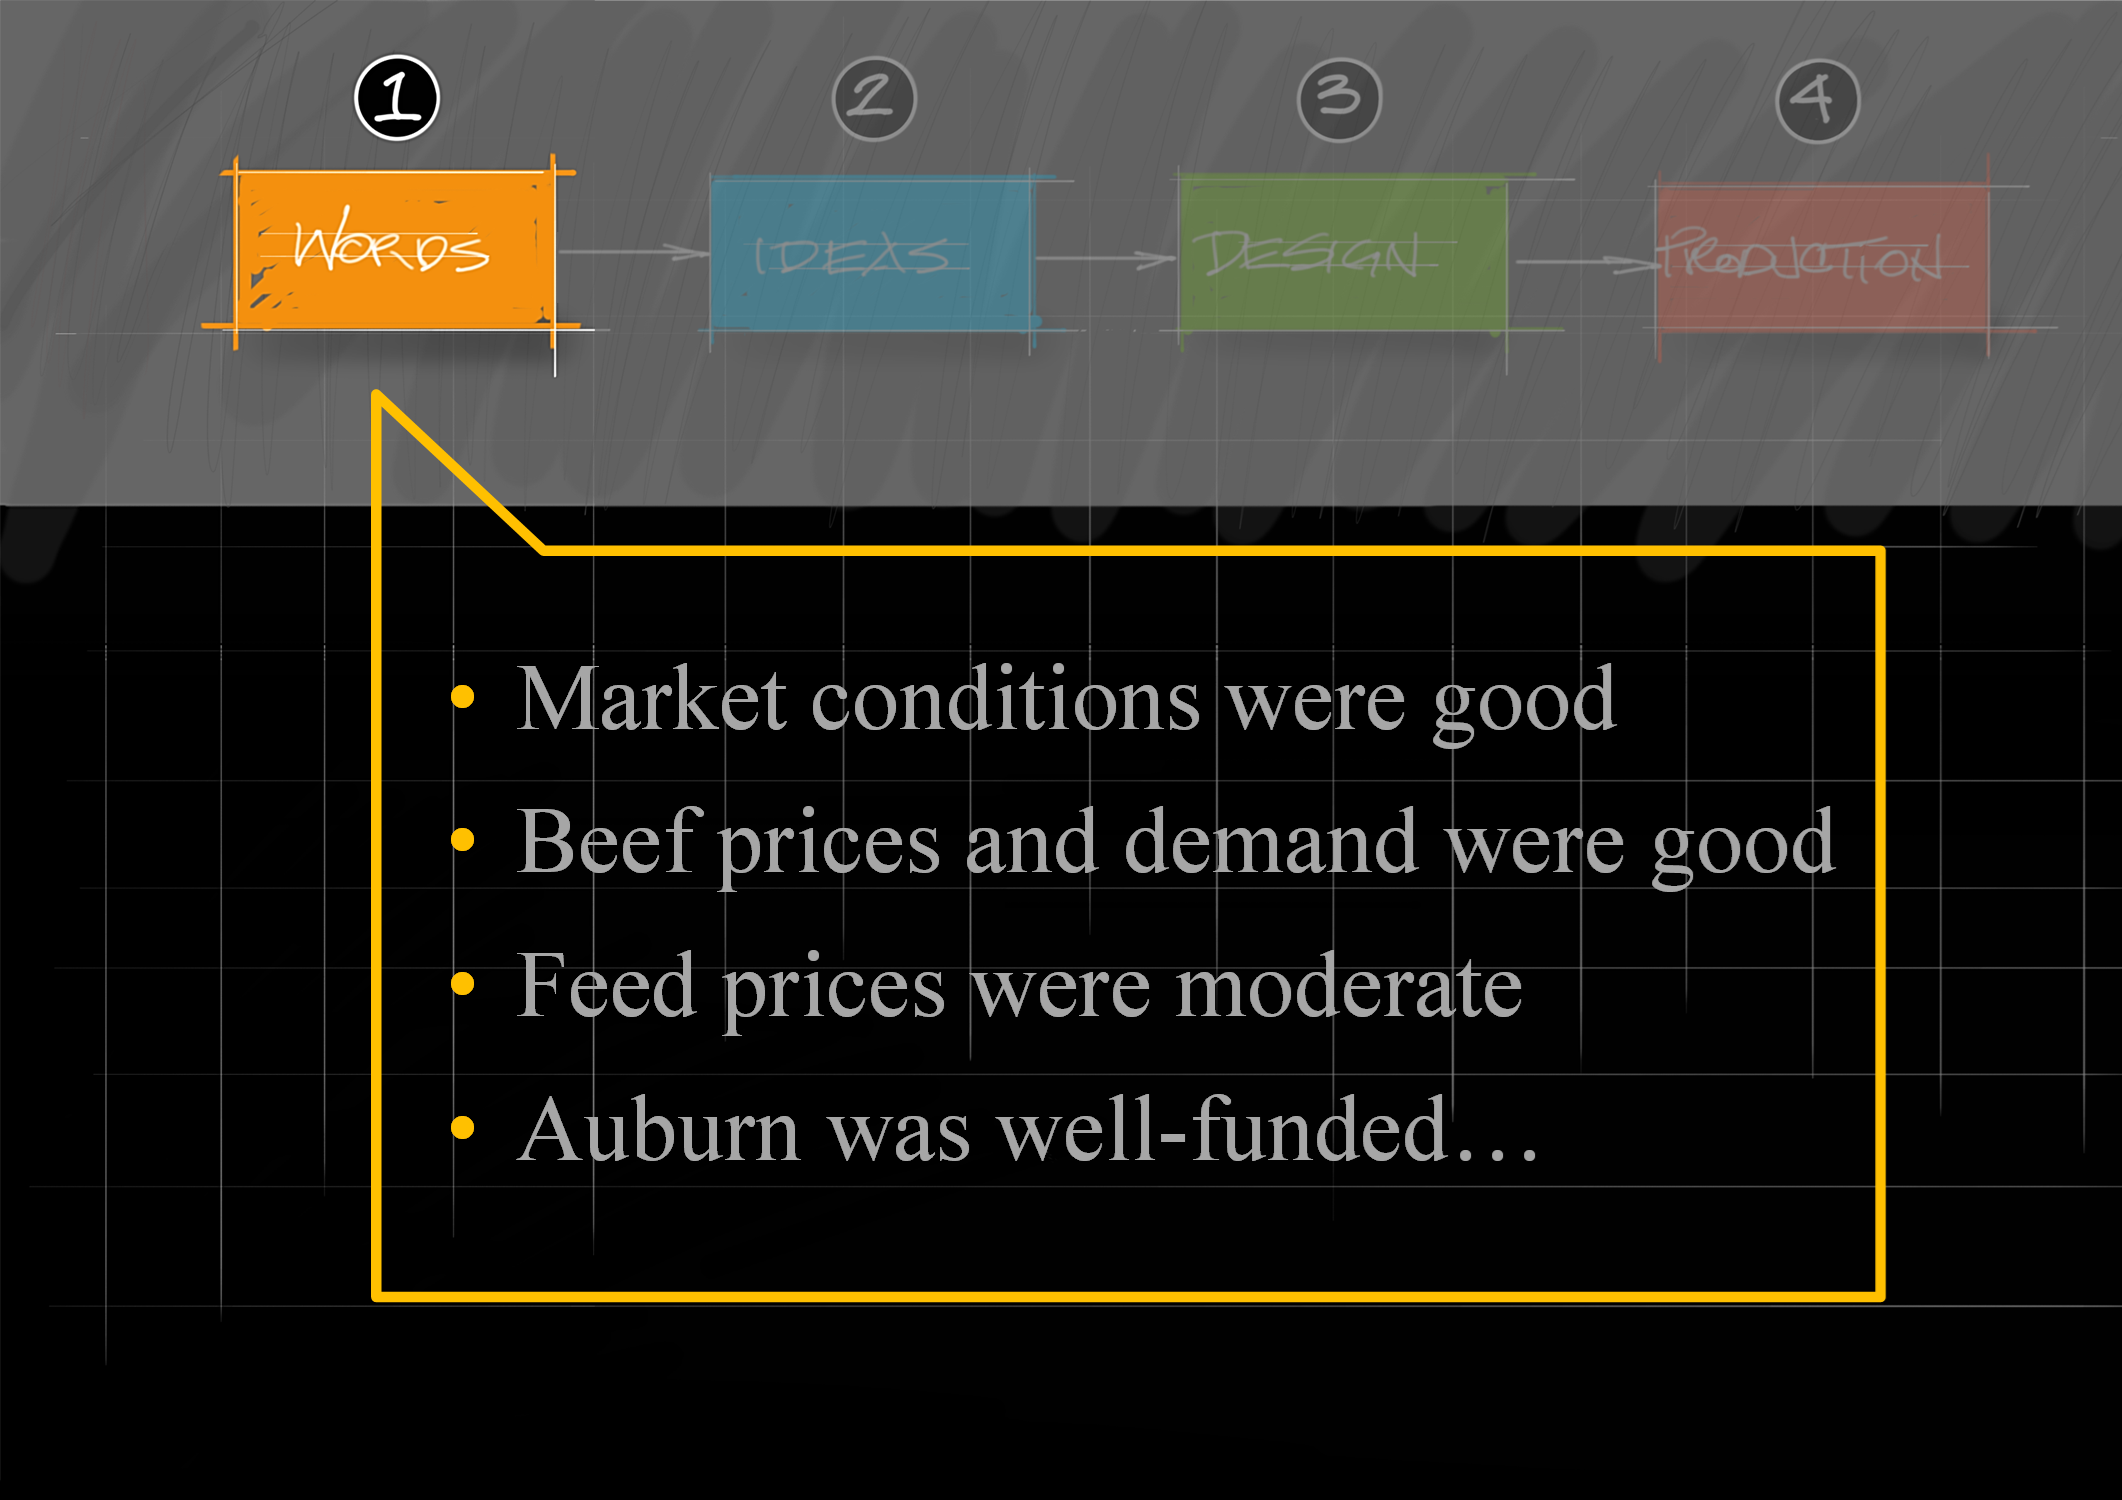
1) Assemble the narrative, even in rough bullet point form—what are you going to be saying?
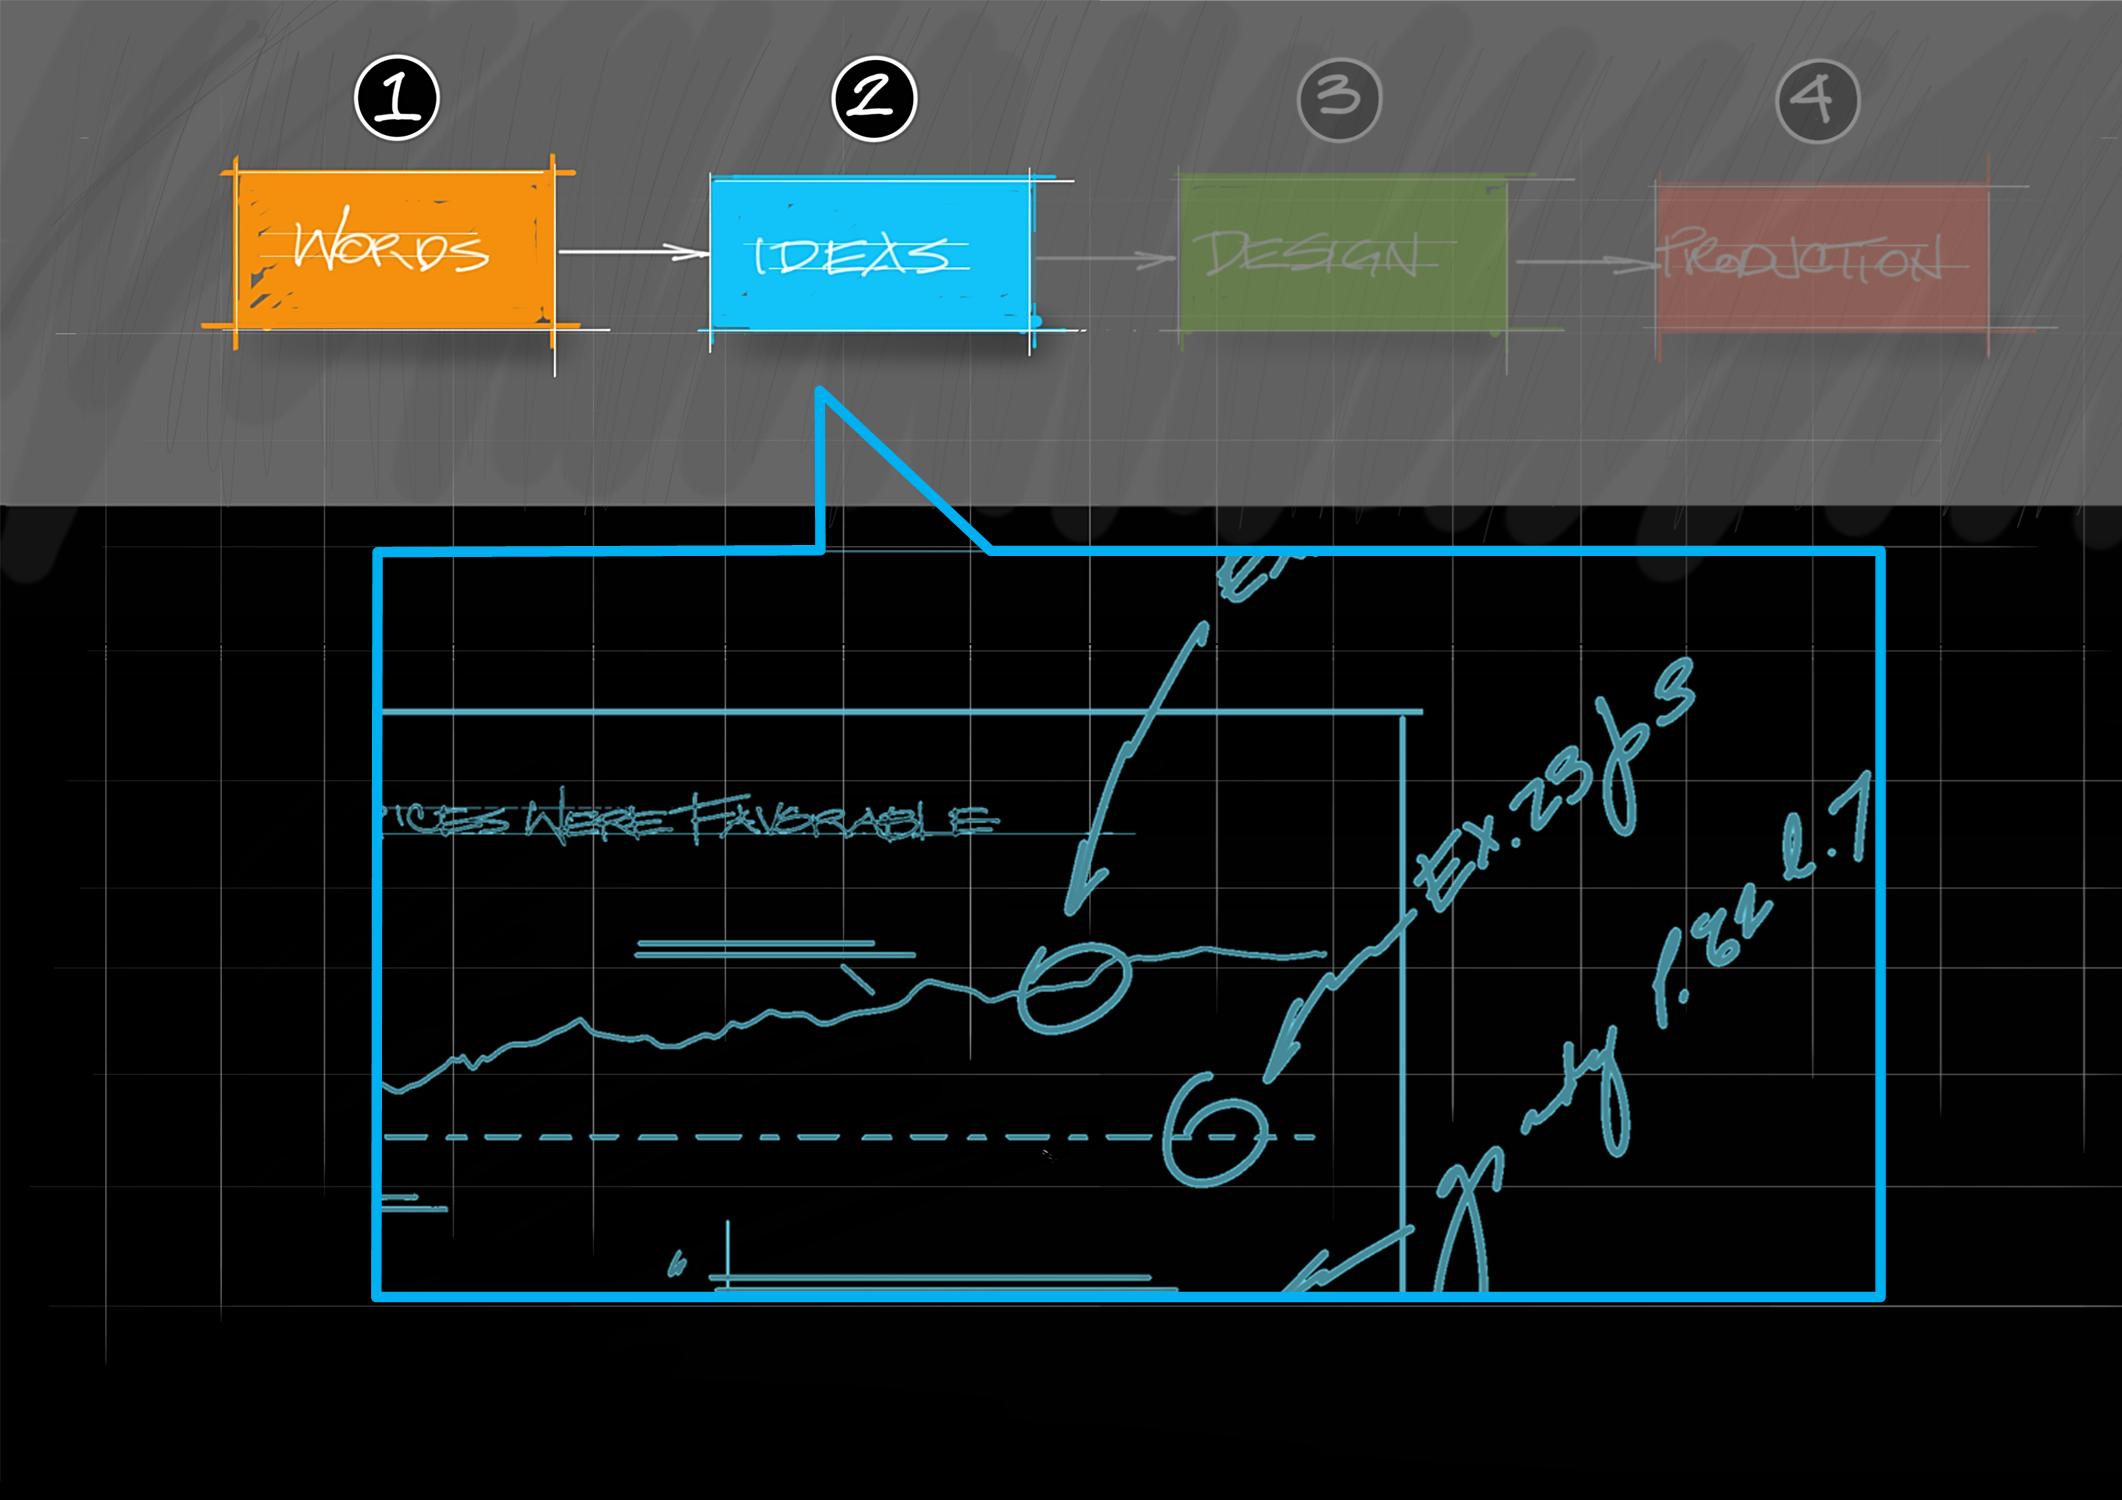
2) Develop ideas for presenting the evidence, data and arguments;
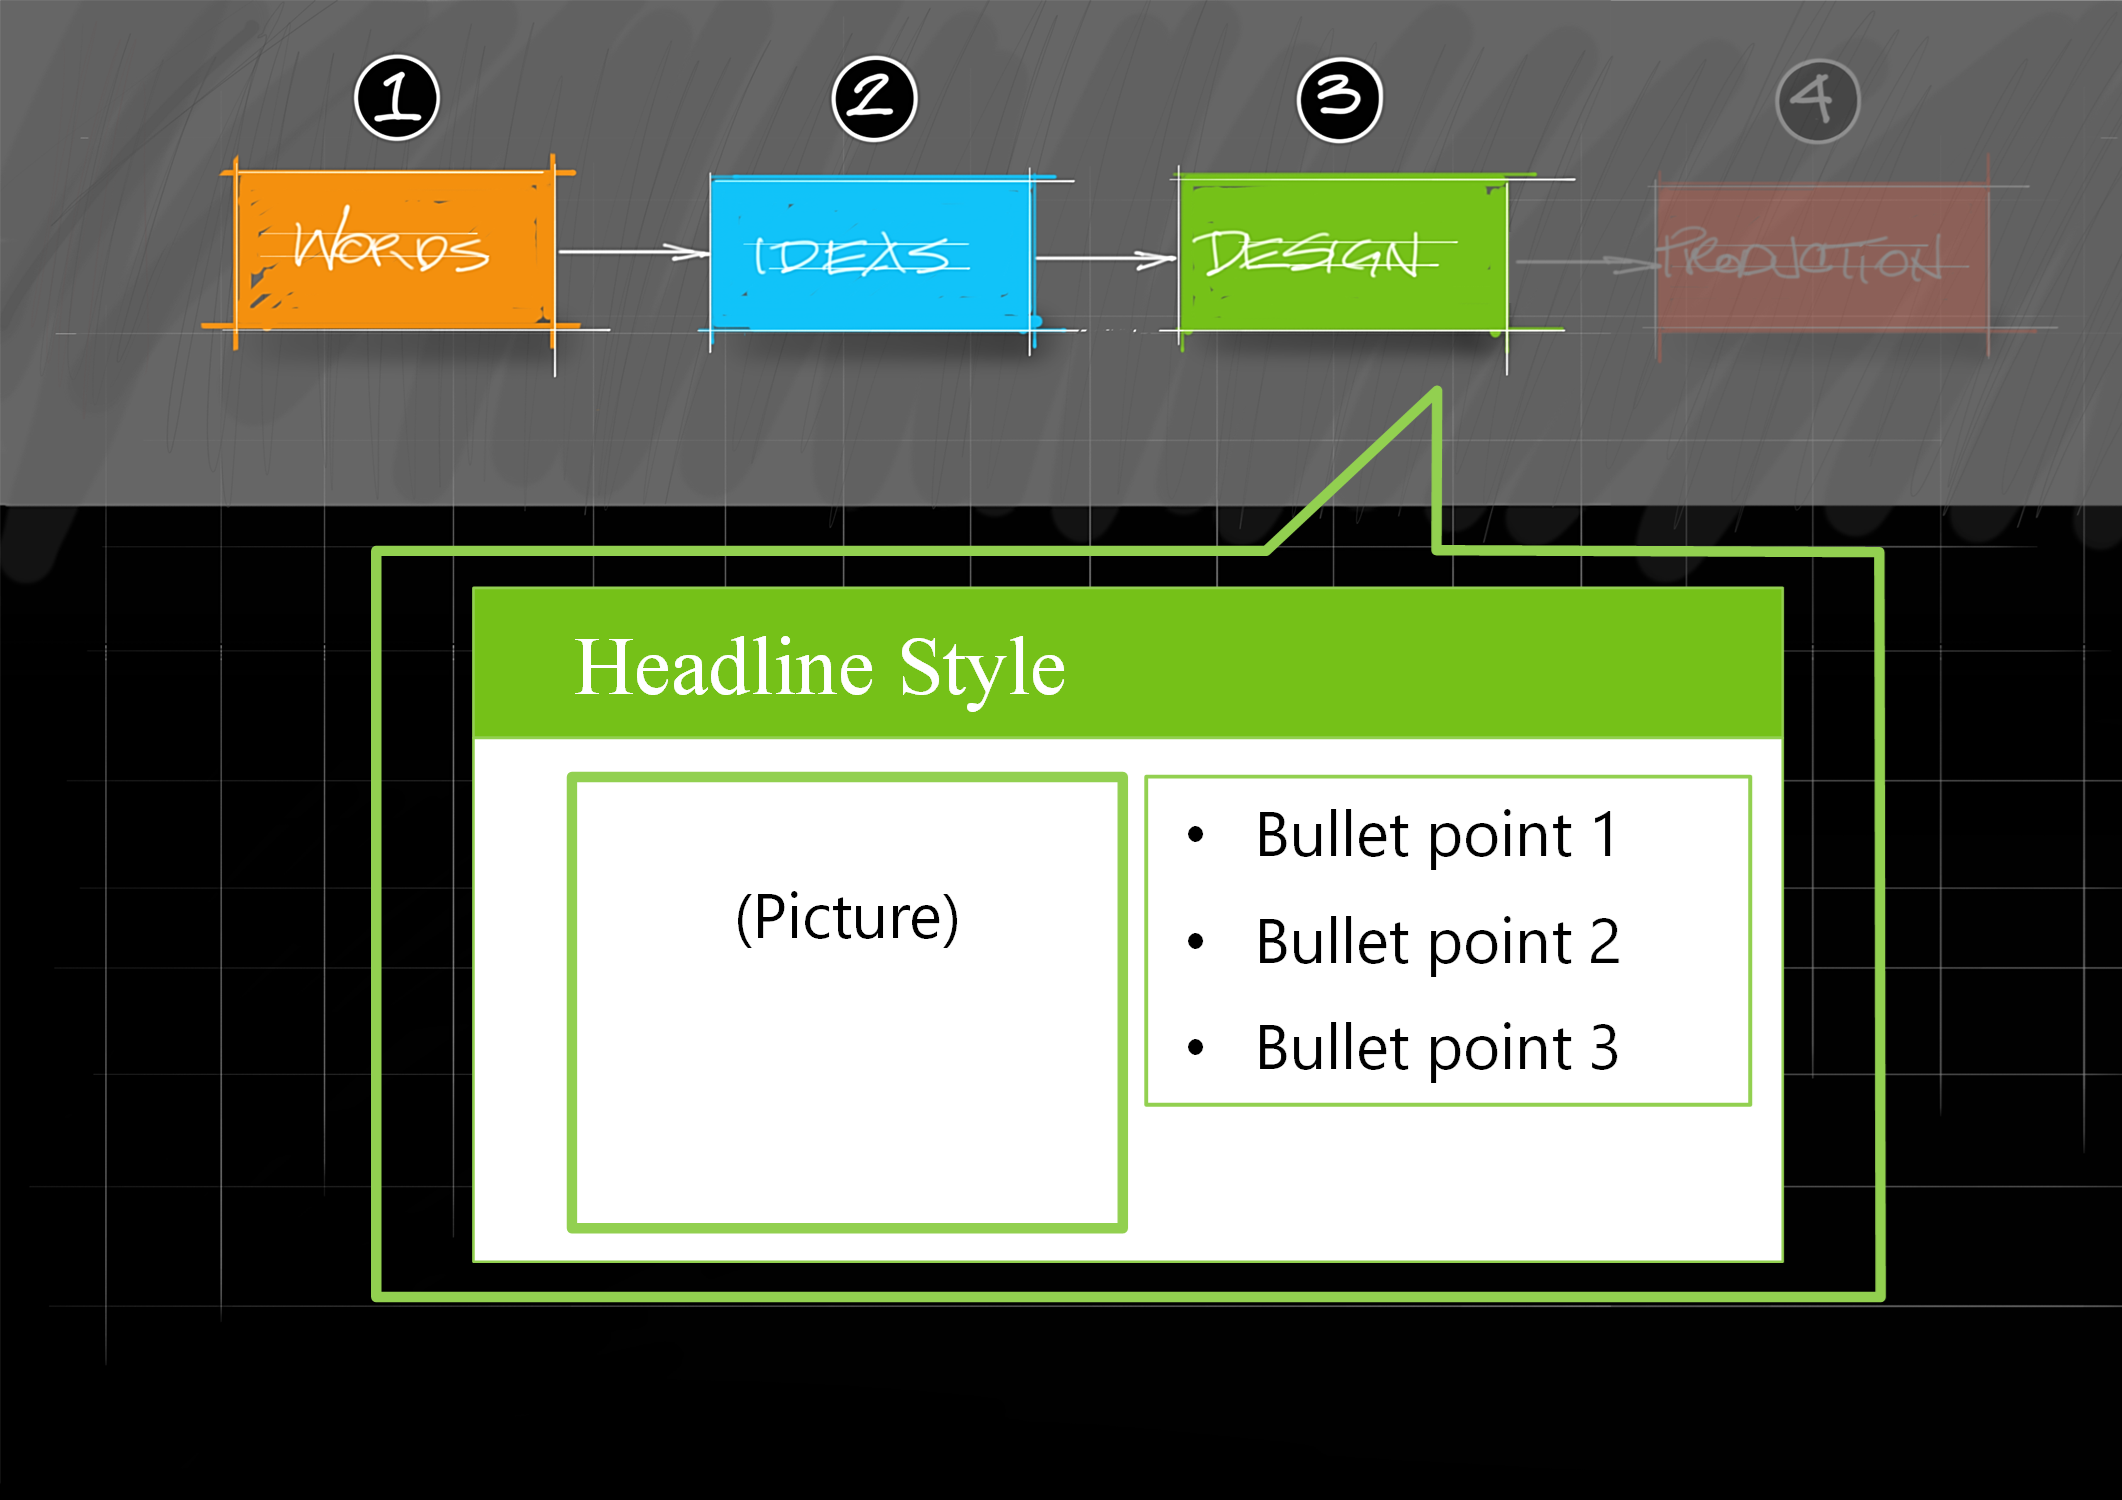
3) Design or adapt a format to fit your exhibit types;
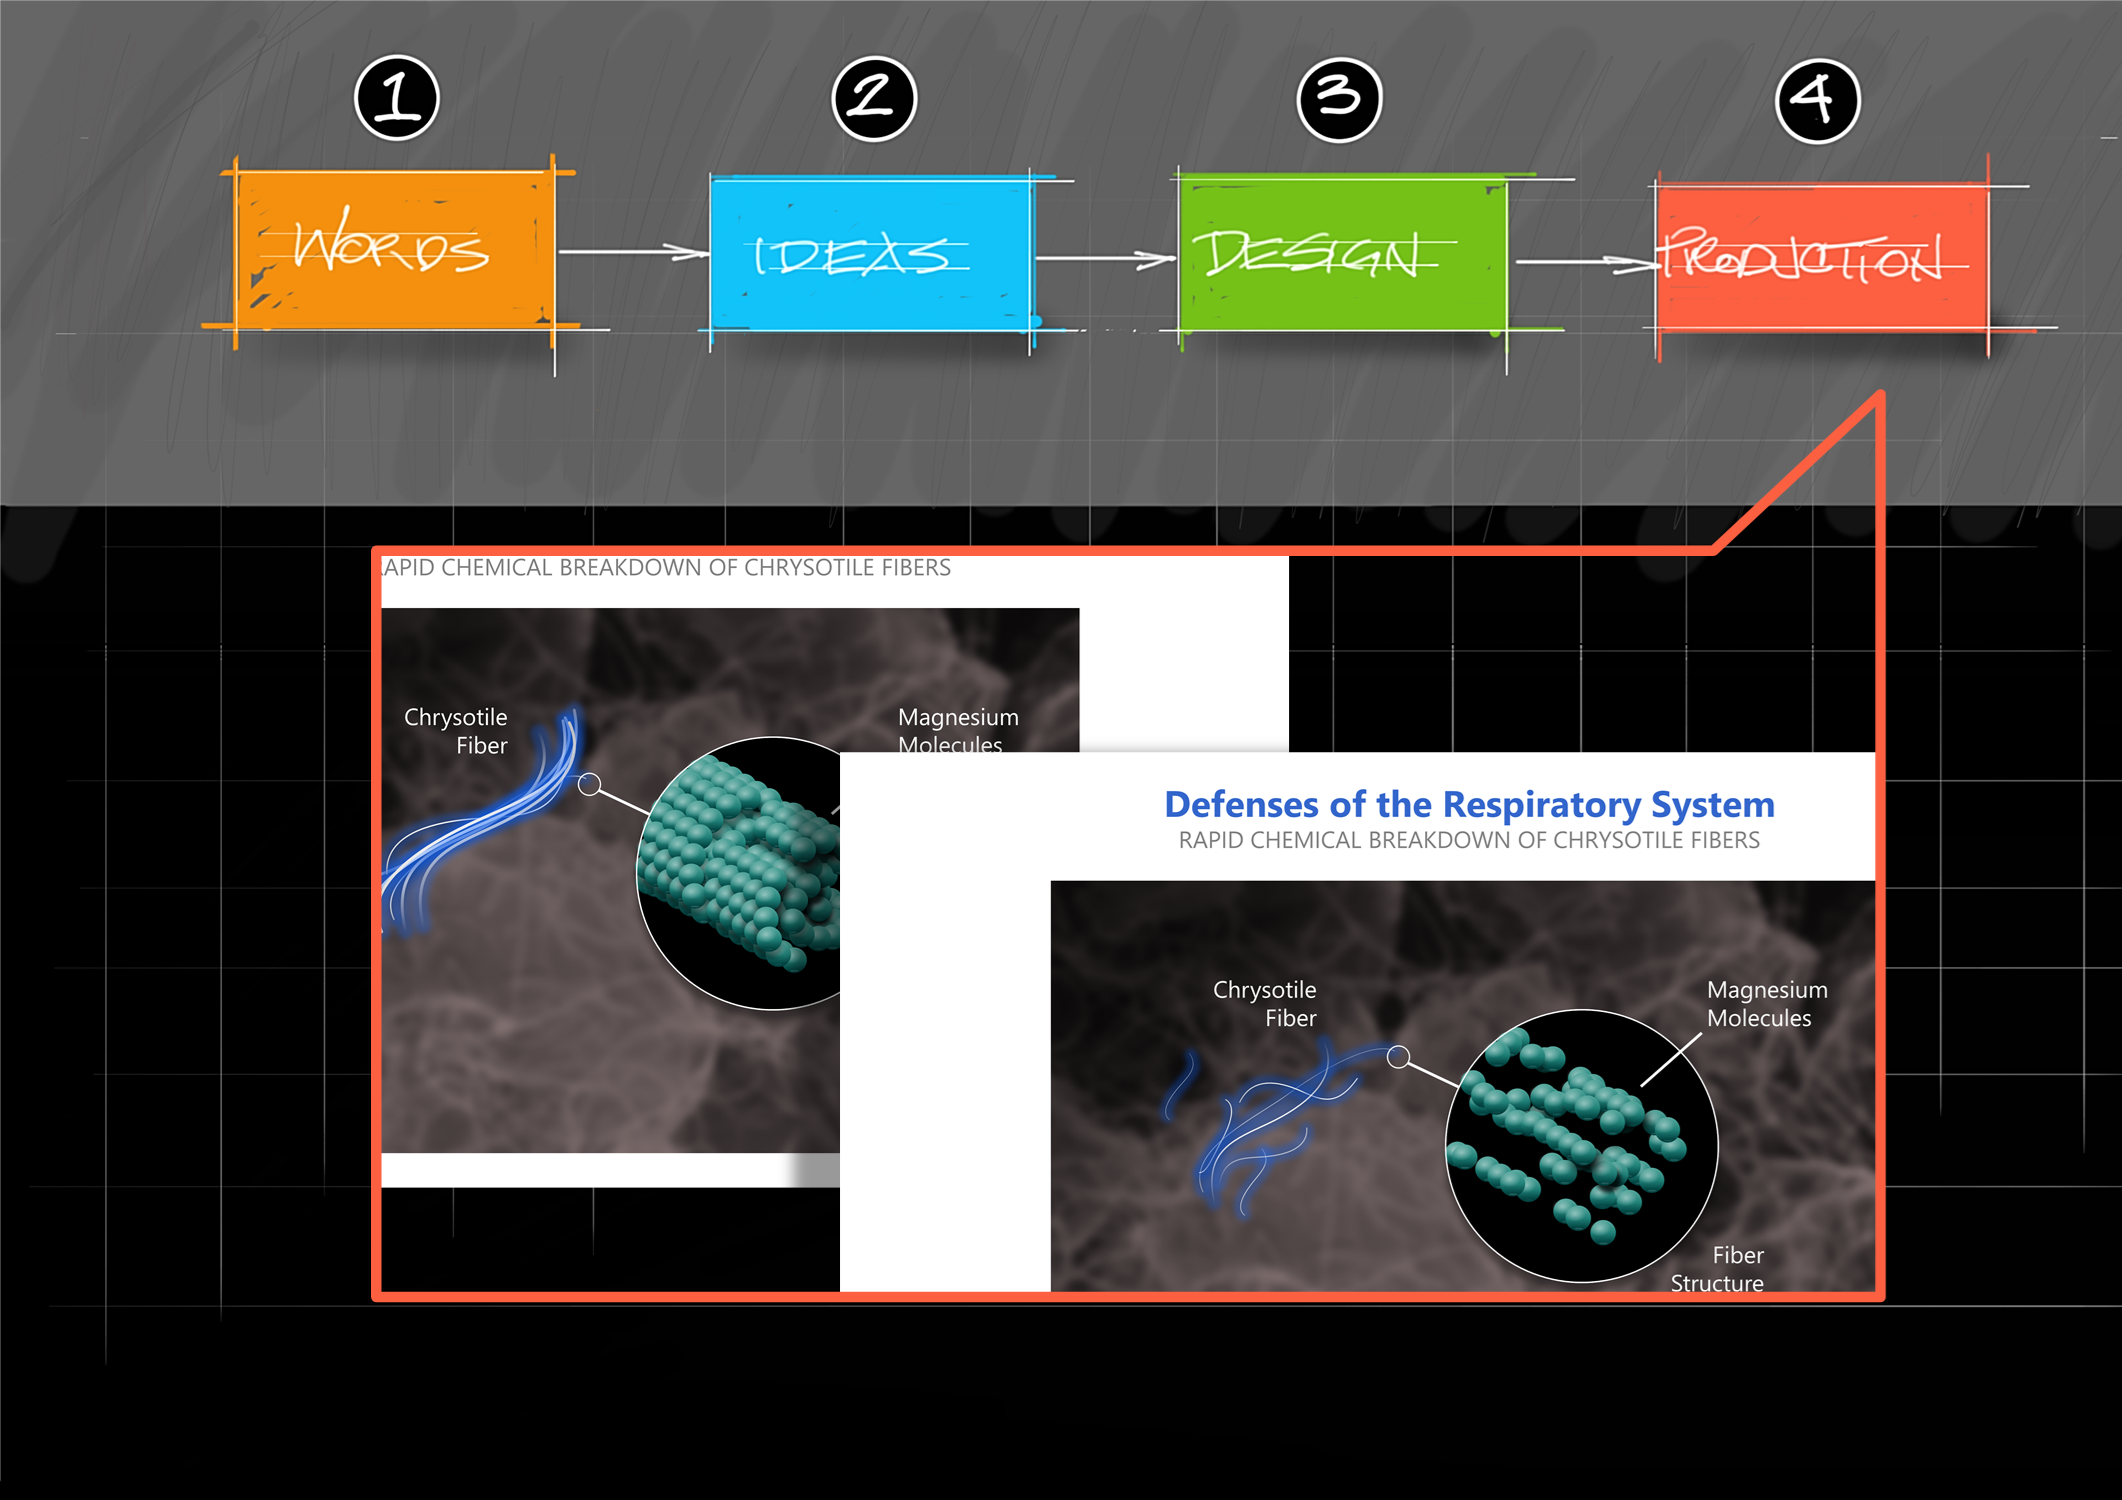
4) Produce the graphs, illustrations and graphics and create a finished deck.
Whether you work with an outside consultant, in-firm resources, or do it yourself, the resulting visualization of your case will benefit from having gone through this process.